UPDATE: here is the spreadsheet with predict vote share and probability for every party in every constituency. SNP and Plaid are both under “nationalists”.
This post provides a forecast of the 2015 UK general election based exclusively on the 2010 results and the Ashcroft constituency polls. No national polls of any kind were used as input. The left-wing block of parties (Labour, SNP, Plaid, Greens, SDLP) has a chance of about 90% of securing a majority in the House of Commons, thereby locking David Cameron out of number 10.
The most likely total of seats in Great Britain for each party after the election, and the 95% probability intervals, are as follows:
- Labour – 276 (253/325)
- Conservatives – 267 (214/291)(including speaker John Bercow)
- SNP – 57 (52/59)
- Liberal Democrats – 23 (16/35)
- Plaid Cymru – 5 (3/7)
- UKIP – 3 (1/8)
- Greens – 1 (1/1)
These add up to 339 seats for the center-left block, 293 seats for the center-right block, and 18 Northern Irish seats for which we have no polling data. This is a moderately comfortable lead for the center-left. A map of the party that’s projected to win each constituency is below:

Methodology
The idea behind this forecast is to split the difference between uniform national swing and pure constituency polling. The forecast for every constituency is a function both of the polling in that constituency and of the polling in similar constituencies. This is why Labour leads in places such as Bermondsey & Old Southwark, where it was nominally behind in the polls with a swing of 9%; the swing from the Lib Dems to Labour has been slightly greater in other Labour-Lib Dems marginals than indicated by the Ashcroft poll there, so we should include that information in the forecast. The result is that the national swing tips the scales in Labour’s favor there, resulting in a forecast swing of 11%.
There is reason to believe this Ashcroft polling-only method overestimates UKIP’s share of the vote. Many of the Ashcroft polls date from the fall, when UKIP was polling significantly higher than it is now. The projected vote percentage for UKIP using this method is over 16%, but the party has been polling closer to 13% in the past month. Nevertheless, this shortcoming shouldn’t have a big effect on the marginal seats; these are the seats that are polled most frequently, so the information from the most recent polls places UKIP at a lower level.
The seats you should be watching for on election night/How can David Cameron keep his job
I will now list for each region of Great Britain all seats where the result is less than 90% certain.
Scotland
You will notice that Scotland wasn’t included in the map above. That is for two reasons. First, it is very big and makes it difficult to see everything else. Second, the election there is very boring; the SNP is projected to win almost every seat comfortably:

Marginal seats in Scotland:
- 1. Berwickshire, Roxburgh & Selkirk (45% SNP, 44% Con, 10% LD)
- 2. Coatbridge, Chryston & Bellshill (89% SNP, 11% Lab)
- 3. Glasgow North East (74% Lab, 26% SNP)
- 4. Orkney & Shetland (61% LD, 39% SNP)
The main story here is that the SNP is an odds-on bet to carry 56 out of 59 Scottish constituencies this election, which is stunning compared to the 6 they carried in the last election. They also have a very real chance of winning all the seats in Scotland. There are only three seats in which they are the underdogs, losing one to each of Labour, Tories and Lib Dems. Ashcroft polls put them slightly behind in Berwickshire and a bit further behind in Glasgow North East, but they have been improving their vote share over the past few months, so there is reason to think that they may have closed the gap since those polls were conducted. They have led in every other poll in Scotland.
London

Marginal seats in London:
- 1. Bermondsey & Old Southwark (81% Lab, 19% LD)
- 2. Croydon Central (75% Lab, 25% Con)
- 3. Ealing Central & Acton (88% Lab, 12% Con)
- 4. Finchley & Golders Green (52% Lab, 48% Con)
- 5. Harrow East (70% Lab, 30% Con)
- 6. Ilford North (72% Con, 28% Lab)
Labour will be one of the most important battlegrounds on election night. There are four seats here where Labour are currently favoured but that the Tories must win if they hope to stay in power. The polling in Croydon Central has been mixed, but Labour only need a 3% swing, which is below the 5% average swing they have been getting in most seats. Labour should also easily pick up two Lib Dem seats, Brent Central and Hornsey & Wood Green, and are favoured in a third, Bermondsey & Old Southwark. If these results are confirmed on election day, the Lib Dems will be confined to four seats on the Southwestern suburbs of London.
South East and East of England
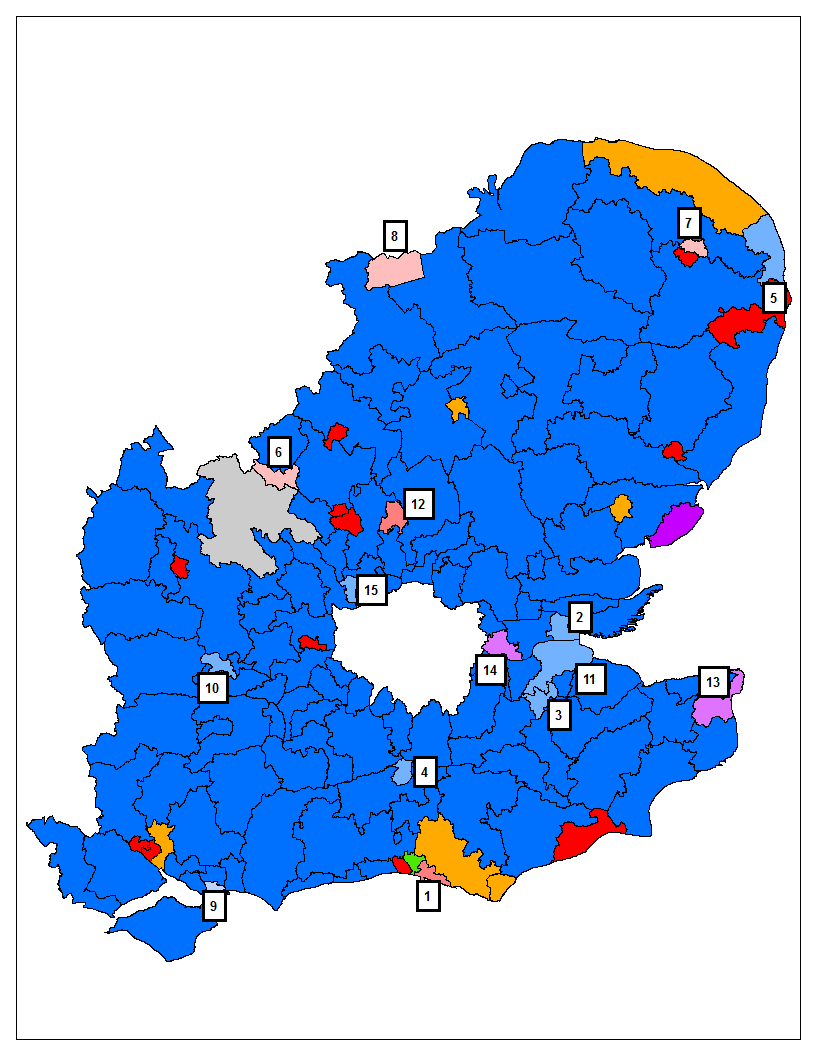
Marginal seats in the SE and E of England:
- 1. Brighton Kemptown (88% Lab, 12% Con)
- 2. Castle Point (78% Con, 22% UKIP)
- 3. Chatham & Aylesford (83% Con, 17% Lab)
- 4. Crawley (77% Con, 23% Lab)
- 5. Great Yarmouth (79% Con, 21% Lab)
- 6. Milton Keynes South (73% Lab, 27% Con)
- 7. Norwich North (74% Lab, 25% Con)
- 8. Peterborough (61% Lab, 39% Con)
- 9. Portsmouth South (71% Con, 29% LD)
- 10. Reading West (78% Con, 22% Lab)
- 11. Rochester & Strood (89% Con, 11% UKIP)
- 12. Stevenage (87% Lab, 13% Con)
- 13. Thanet South (50% UKIP, 50% Con)
- 14. Thurrock (72% UKIP, 28% Lab)
- 15. Watford (84% Con, 15% Lab)
This is just as important a battleground as London. The theme here is medium-to-small sized towns. The Tories’ path to victory lies through the 5 seats where they are underdogs here: Stevenage, Brighton Kemptown, Milton Keynes South, Norwich North and Peterborough. If Labour carries a few of the ones where they are not favoured, such as Great Yarmouth and Reading West, we will know they are having a great night.
This is also UKIP’s heartland. They have a lock on Clacton, are favored to win Thurrock, and have an outside shot of keeping Rochester & Strood and winning Castle Point. And then there’s Thanet South, where Nigel Farage is running, and the race is extremely close; it’s as close to a toss up as it comes.
South West and Wales
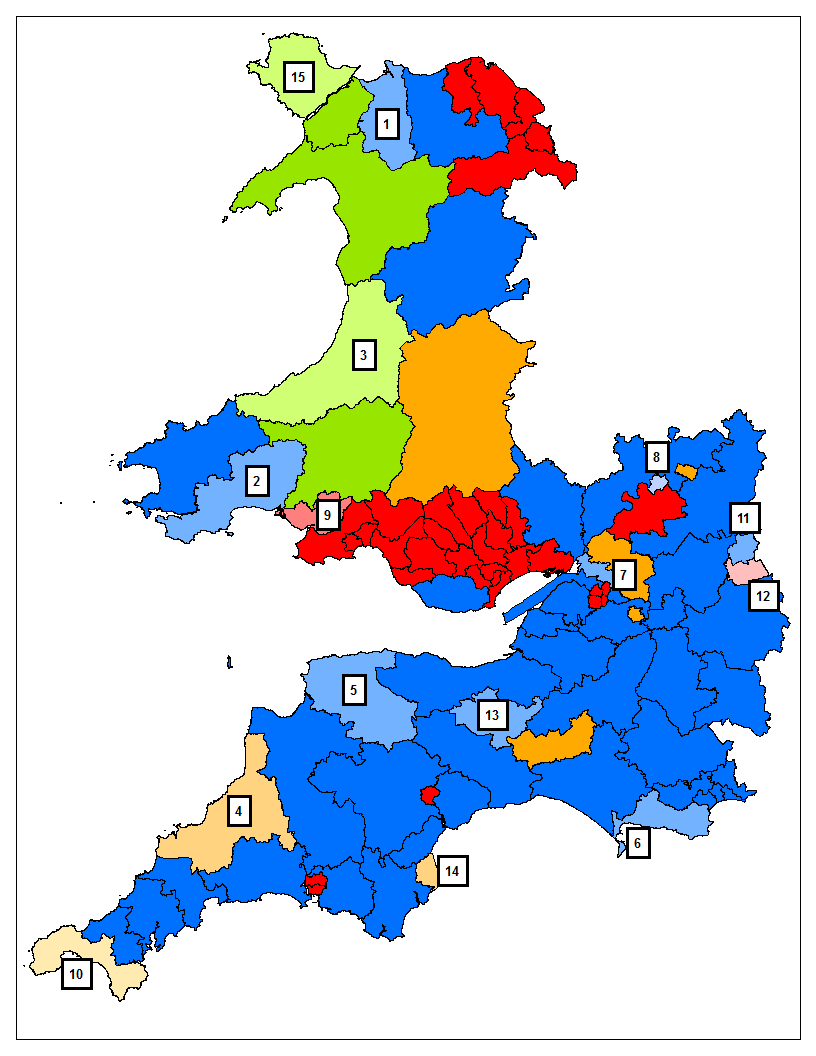
Marginal seats in the SW and Wales:
- 1. Aberconwy (77% Con, 16% Plaid, 6% Lab)
- 2. Carmarthen West & Pembrokeshire South (84% Con, 16% Lab)
- 3. Ceredigion (50% Plaid, 50% LD)
- 4. Cornwall North (87% LD, 13% Con)
- 5. Devon North (87% Con, 13% LD)
- 6. Dorset South (87% Con, 13% Lab)
- 7. Filton & Bradley Stoke (87% Con, 13% Lab)
- 8. Gloucester (67% Con, 33% Lab)
- 9. Llanelli (79% Lab, 21% Plaid)
- 10. St Ives (74% LD, 26% Con)
- 11. Swindon North (85% Con, 15% Lab)
- 12. Swindon South (58% Lab, 42% Con)
- 13. Taunton Deane (76% Con, 24% LD)
- 14. Torbay (78% LD, 22% Con)
- 15. Ynys Mon (64% Plaid, 36% Lab)
The South West is ground zero for the battle between the Tories and the Lib Dems. It is, however, not very important for deciding who will be the next PM, since both the Tories and the Lib Dems are in the coalition; the results of their marginals don’t matter very much. Perhaps the only constituency worth watching out for is Swindon South, which has had extremely balanced polling between the two main parties.
Amidst all the talk about the SNP, Plaid Cymru has been a bit neglected. They have a very good chance of picking up a few seats in Welsh-speaking West Wales, and that’s based on polls conducted before Leanne Wood appeared on the TV debates, which should certainly improve Plaid’s fortunes.
Midlands

Marginal seats in the Midlands:
- 1. Birmingham Yardley (81% Lab, 19% LD)
- 2. Boston & Skegness (52% Con, 48% UKIP)
- 3. Burton (79% Con, 21% Lab)
- 4. Derbyshire South (85% Con, 15% Lab)
- 5. Dudley South (79% Con, 21% Lab)
- 6. Halesowen & Rowley Regis (75% Lab, 25% Con)
- 7. High Peak (58% Con, 42% Lab)
- 8. Leicestershire North West (87% Con, 13% Lab)
- 9. Lincoln (88% Lab, 12% Con)
- 10. Northampton North (82% Lab, 18% Con)
- 11. Northampton South (83% Con, 17% Lab)
- 12. Redditch (81% Con, 19% Lab)
- 13. Rugby (79% Con, 21% Lab)
- 14. Stafford (69% Con, 31% Lab)
- 15. Staffordshire Moorlands (88% Con, 12% Lab)
- 16. Stourbridge (78% Con, 22% Lab)
- 17. Tamworth (80% Con, 20% Lab)
- 18. Warwick & Leamington (78% Con, 22% Lab)
- 19. Worcester (63% Con, 37% Lab)
- 20. Wyre Forest (66% Con, 34% UKIP)
There are a lot of “marginal” seats in the Midlands, but most of them are Labour longshots. If Labour win in places such as Stafford and Stourbridge, it will be pretty obvious that they have won very early in the night. If they win most of these seats, they may even be able to avoid depending on the SNP (and depending on the Lib Dems instead). If they fail to win seats such as Halesowen & Rowley Regis or Lincoln, to say nothing of seats like Nuneaton, which is not listed, Ed Miliband has reason to be worried about his future. UKIP have two potential gains here; Boston & Skegness is one of their top targets, whereas Wyre Forest is a seat that had an independent MP for many years, and where UKIP were polling well last year.
The North

Marginal seats in the North:
- 1. Berwick-upon-Tweed (75% Con, 25% LD)
- 2. Blackpool North & Cleveleys (82% Con, 18% Lab)
- 3. Brigg & Goole (74% Con, 26% Lab)
- 4. Calder Valley (78% Con, 22% Lab)
- 5. Cleethorpes (65% Con, 35% Lab)
- 6. Colne Valley (73% Con, 27% Lab)
- 7. Crewe & Nantwich (30% Con, 70% Lab)
- 8. Elmet & Rothwell (76% Con, 24% Lab)
- 9. Leeds North West (71% Lab, 29% LD)
- 10. Pudsey (54% Lab, 46% Con)
- 11. Rossendale & Darwen (50% Con, 50% Lab)
- 12. South Ribble (51% Con, 49% Lab)
Again, some Labour longshots, but there are three constituencies here that are almost perfectly balanced between the two main parties: Pudsey, Rossendale & Darwen, and South Ribble. The result in these three constituencies should be a good indication of whether the parties will over- or underperform their forecasts.
The keen-eyed will have noted that Sheffield Hallam didn’t make the list. the model gives Nick Clegg only a 5% chance of hanging onto his seat. There have been 3 polls of Sheffield Hallam and in all 3 the Labour candidate has been consistently leading the Lib Dem leader.